Infrastructure is the cornerstone of Big Data architecture. Possessing the right tools for storing, processing and analysing your data is crucial in any Big Data project. In last installment of “Understanding Big Data”, we provided a general overview of all of the technologies in the Big Data landscape. In this edition, we’ll be closely examining infrastructural approaches- what they are, how they work and what each approach is best used for. Hadoop To recap, Hadoop is essentially an open-source framework for processing, storing and analysing data. The fundamental principle behind Hadoop is rather than tackling one monolithic block of data all in one go, it’s more efficient to break up & distribute data into many parts, allowing processing and analysing of different parts concurrently. When hearing Hadoop discussed, it’s easy…
We recently reported on how Netflix is using big data algorithms to power its recommendation system; now, a Netflix blog post highlights other ways in which the company is using big data behind the scenes to enrich its service. They’re putting the data to work largely to improve Quality of Experience (QoE)- the experience the user has after they hit play. The blog post, written by Director of Streaming Science & Algorithms Nirmal Govind, walks us through several ways in which data is enhancing the quality of experience. The first approach outlined is looking at “the algorithms that run in real-time or near real-time once playback has started, which determine what bitrate should be served, what server to download that content from, etc.” “With vast amounts of data, the mapping…
With the recent furore among cab drivers about the growing prominence of Uber in London, Paris, Milan, Madrid and Berlin, we thought it would be interesting to see how the mobile-app, car-for-hire company uses big data to better its services. Below are 2 ways Uber has used data to understand the behaviour, location, and preferences of their customers, as well as interesting correlations between crime rates and Uber usage. We were surprised by the results, and thought our readers might be too. 1) Prostitution and Alcohol Promote Uber Usage A few years ago, Uber’s team of data scientists (only three at that point) were trying to understand how to effectively manage the positioning of cab drivers in order to allocate them to the busiest areas at the right times. Of…
In an article last week, we looked at whether data analytics could help us predict the winner of the world cup. Admittedly, it is unclear whether big data will have any effect in the predictions we make in this field, but the possibility of it being used in something as complex and unpredictable as sports is an interesting prospect. After a press conference yesterday in Brazil, it seems as though the German football team has caught onto this and is not taking big data’s importance in football lightly. At the announcement, Germany’s manager Oliver Bierhoff, announced that the National Team has been collaborating with SAP and the German Football Association to apply big data, through SAP’s Match Insights software, to assess the performance and training of the team in preparation…
In an attempt similar to Google Flu Trends, The Chinese Centre for Disease Control and Prevention will be working with online search giant Baidu to use its large user database to help forecast flu outbreaks. The deputy director of the Centre, Gao Fu, suggested that the prediction tool may be available later this year and that “big data will play a major role in safeguarding and improving public health.” Although Baidu declined to comment on the health-project, saying it is still being developed, the initiative could in theory be vital for health officials when predicting outbreaks in certain localities. The increase in H7N9 infections – including the deaths in Zhejiang this year – has led to the country being “perpetually on alert against the threat of pandemics,” and initiatives like…
Only a decade ago, to speak of Africa and technology would have seemed nonsensical. Today, it is part of a growing global conversation. Mobile penetration rates have increased 19 percent annually over the past five years, making the continent’s technological future look especially promising. The use of mobile phones has opened up new opportunities for healthcare, education, and financial services. Kenya’s M-PESA, a micro-financing tool that allows users to deposit, withdraw and transfer money via their mobile, is a notable example of how technology is radically changing the lives of many Africans. Within just five years of its inception, M-PESA has over 17 million users and 31 percent of Kenya’s GDP travels through the system. However, tools like M-PESA are only the beginning of what could be a comprehensive digital…
This week we looked at Big Data’s influence around the world: How it is being used by scientists attempting to predict the winner of the 2014 world cup in Brazil, how it is spreading throughout Africa by way of foreign investment, and how it has been used in the US to refine election boundaries. All together, another exciting week in a field that is penetrating the lives of people everywhere. See our pick of the week’s findings below. TOP DATACONOMY ARTICLES A Land of Disparity: Revisiting Africa’s “Technology Boom” Only a decade ago, to speak of Africa and technology would have seemed nonsensical. Today, it is part of a growing global conversation. Predicting the World Cup with Big Data This time next week, we will be in the throes of World…
Gerrymandering in the US is a serious issue. The Washington Post estimates that as a result of gerrymandering, the Democrats under-represented by about 18 seats in the House, relative to their vote share in the 2012 election. Brian Olson, a software engineer from Massachusetts, has devised a programme which works out the most “optimally compact” districts based on 2010 census data, and avoids the need for human, politically-biased involvement in the drawing of district lines. Brian Olson describes his methodology: It looks at the boundaries between districts and tries to make things better by flipping one block from district A to district B (and possibly over some number of steps, other blocks from B to C and C to A). It doesn’t actually directly optimize the measure of population compactness,…
This time next week, we will be in the throes of World Cup fever. As we speak, beers are being readied, projection screens are being mounted, and unrealistic levels of national pride and aspiration are mounting. Already, stats and predictions for almost every facet of the event are flooding in; Brazil are expecting 3.7 million visitors, and a $3.03 billion boost to their economy; Panini are expecting £89.1 million in sticker sales in Brazil alone; in the UK, Domino’s Pizza stands to make an estimated £84 million during the World Cup. The one area where facts and figures seem comparatively scarce is in accurately predicting the World Cup winner. We can estimate how many people will be flying out to Brazil, how many pizzas the Brits will consume in front…
In the Ted Talk below, Computer Scientist Jennifer Golbeck tells the story of how ones Facebook Likes show strong correlations to seemingly unrelated personal attributes – the often cited example is how Liking the page “Curly Fries” is a strong indicator of high IQ, or Liking “That Spider is More Scared Than U Are” correlates to being a non-smokers. Golbeck’s comments in the TedTalk were based on a study conducted by the University of Cambridge last year, where researchers studied a dataset of 58,000 U.S. Facebook users and created statistical models able to predict personal details using Facebook Likes alone. “Models proved 88% accurate for determining male sexuality, 95% accurate distinguishing African-American from Caucasian American and 85% accurate differentiating Republican from Democrat. Christians and Muslims were correctly classified in 82%…


 Infrastructure is the cornerstone of Big Data architecture. Possessing the right tools for storing, processing and analysing your data is crucial in any Big Data project. In last installment of “Understanding Big Data”, we provided a general overview of all of the technologies in the Big Data landscape. In this edition, we’ll be closely examining infrastructural approaches- what they are, how they work and what each approach is best used for. Hadoop To recap, Hadoop is essentially an open-source framework for processing, storing and analysing data. The fundamental principle behind Hadoop is rather than tackling one monolithic block of data all in one go, it’s more efficient to break up & distribute data into many parts, allowing processing and analysing of different parts concurrently. When hearing Hadoop discussed, it’s easy…
 We recently reported on how Netflix is using big data algorithms to power its recommendation system; now, a Netflix blog post highlights other ways in which the company is using big data behind the scenes to enrich its service. They’re putting the data to work largely to improve Quality of Experience (QoE)- the experience the user has after they hit play. The blog post, written by Director of Streaming Science & Algorithms Nirmal Govind, walks us through several ways in which data is enhancing the quality of experience. The first approach outlined is looking at “the algorithms that run in real-time or near real-time once playback has started, which determine what bitrate should be served, what server to download that content from, etc.” “With vast amounts of data, the mapping…
 With the recent furore among cab drivers about the growing prominence of Uber in London, Paris, Milan, Madrid and Berlin, we thought it would be interesting to see how the mobile-app, car-for-hire company uses big data to better its services. Below are 2 ways Uber has used data to understand the behaviour, location, and preferences of their customers, as well as interesting correlations between crime rates and Uber usage. We were surprised by the results, and thought our readers might be too. 1) Prostitution and Alcohol Promote Uber Usage A few years ago, Uber’s team of data scientists (only three at that point) were trying to understand how to effectively manage the positioning of cab drivers in order to allocate them to the busiest areas at the right times. Of…
 In an article last week, we looked at whether data analytics could help us predict the winner of the world cup. Admittedly, it is unclear whether big data will have any effect in the predictions we make in this field, but the possibility of it being used in something as complex and unpredictable as sports is an interesting prospect. After a press conference yesterday in Brazil, it seems as though the German football team has caught onto this and is not taking big data’s importance in football lightly. At the announcement, Germany’s manager Oliver Bierhoff, announced that the National Team has been collaborating with SAP and the German Football Association to apply big data, through SAP’s Match Insights software, to assess the performance and training of the team in preparation…
 In an attempt similar to Google Flu Trends, The Chinese Centre for Disease Control and Prevention will be working with online search giant Baidu to use its large user database to help forecast flu outbreaks. The deputy director of the Centre, Gao Fu, suggested that the prediction tool may be available later this year and that “big data will play a major role in safeguarding and improving public health.” Although Baidu declined to comment on the health-project, saying it is still being developed, the initiative could in theory be vital for health officials when predicting outbreaks in certain localities. The increase in H7N9 infections – including the deaths in Zhejiang this year – has led to the country being “perpetually on alert against the threat of pandemics,” and initiatives like…
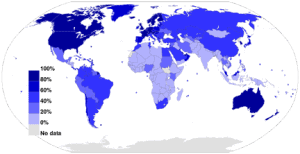 Only a decade ago, to speak of Africa and technology would have seemed nonsensical. Today, it is part of a growing global conversation. Mobile penetration rates have increased 19 percent annually over the past five years, making the continent’s technological future look especially promising. The use of mobile phones has opened up new opportunities for healthcare, education, and financial services. Kenya’s M-PESA, a micro-financing tool that allows users to deposit, withdraw and transfer money via their mobile, is a notable example of how technology is radically changing the lives of many Africans. Within just five years of its inception, M-PESA has over 17 million users and 31 percent of Kenya’s GDP travels through the system. However, tools like M-PESA are only the beginning of what could be a comprehensive digital…
 This week we looked at Big Data’s influence around the world: How it is being used by scientists attempting to predict the winner of the 2014 world cup in Brazil, how it is spreading throughout Africa by way of foreign investment, and how it has been used in the US to refine election boundaries. All together, another exciting week in a field that is penetrating the lives of people everywhere. See our pick of the week’s findings below. TOP DATACONOMY ARTICLES A Land of Disparity: Revisiting Africa’s “Technology Boom” Only a decade ago, to speak of Africa and technology would have seemed nonsensical. Today, it is part of a growing global conversation. Predicting the World Cup with Big Data This time next week, we will be in the throes of World…
 Gerrymandering in the US is a serious issue. The Washington Post estimates that as a result of gerrymandering, the Democrats under-represented by about 18 seats in the House, relative to their vote share in the 2012 election. Brian Olson, a software engineer from Massachusetts, has devised a programme which works out the most “optimally compact” districts based on 2010 census data, and avoids the need for human, politically-biased involvement in the drawing of district lines. Brian Olson describes his methodology: It looks at the boundaries between districts and tries to make things better by flipping one block from district A to district B (and possibly over some number of steps, other blocks from B to C and C to A). It doesn’t actually directly optimize the measure of population compactness,…
 This time next week, we will be in the throes of World Cup fever. As we speak, beers are being readied, projection screens are being mounted, and unrealistic levels of national pride and aspiration are mounting. Already, stats and predictions for almost every facet of the event are flooding in; Brazil are expecting 3.7 million visitors, and a $3.03 billion boost to their economy; Panini are expecting £89.1 million in sticker sales in Brazil alone; in the UK, Domino’s Pizza stands to make an estimated £84 million during the World Cup. The one area where facts and figures seem comparatively scarce is in accurately predicting the World Cup winner. We can estimate how many people will be flying out to Brazil, how many pizzas the Brits will consume in front…
 In the Ted Talk below, Computer Scientist Jennifer Golbeck tells the story of how ones Facebook Likes show strong correlations to seemingly unrelated personal attributes – the often cited example is how Liking the page “Curly Fries” is a strong indicator of high IQ, or Liking “That Spider is More Scared Than U Are” correlates to being a non-smokers. Golbeck’s comments in the TedTalk were based on a study conducted by the University of Cambridge last year, where researchers studied a dataset of 58,000 U.S. Facebook users and created statistical models able to predict personal details using Facebook Likes alone. “Models proved 88% accurate for determining male sexuality, 95% accurate distinguishing African-American from Caucasian American and 85% accurate differentiating Republican from Democrat. Christians and Muslims were correctly classified in 82%…